Data & Analytics
Illuminate the Story Behind Your Data

Turn insights into impact.

In a world overflowing with information, success lies in clarity. CYBERCUBE helps you decode complexity through tailored analytics platforms designed to reveal what truly matters. We transform raw data into clear, interactive visualizations that empower you to see your business from new angles.

Solutions that transform data into decisions.

Interactive Dashboards icon

Interactive Dashboards

Custom-built interfaces tailored to your KPIs and roles.

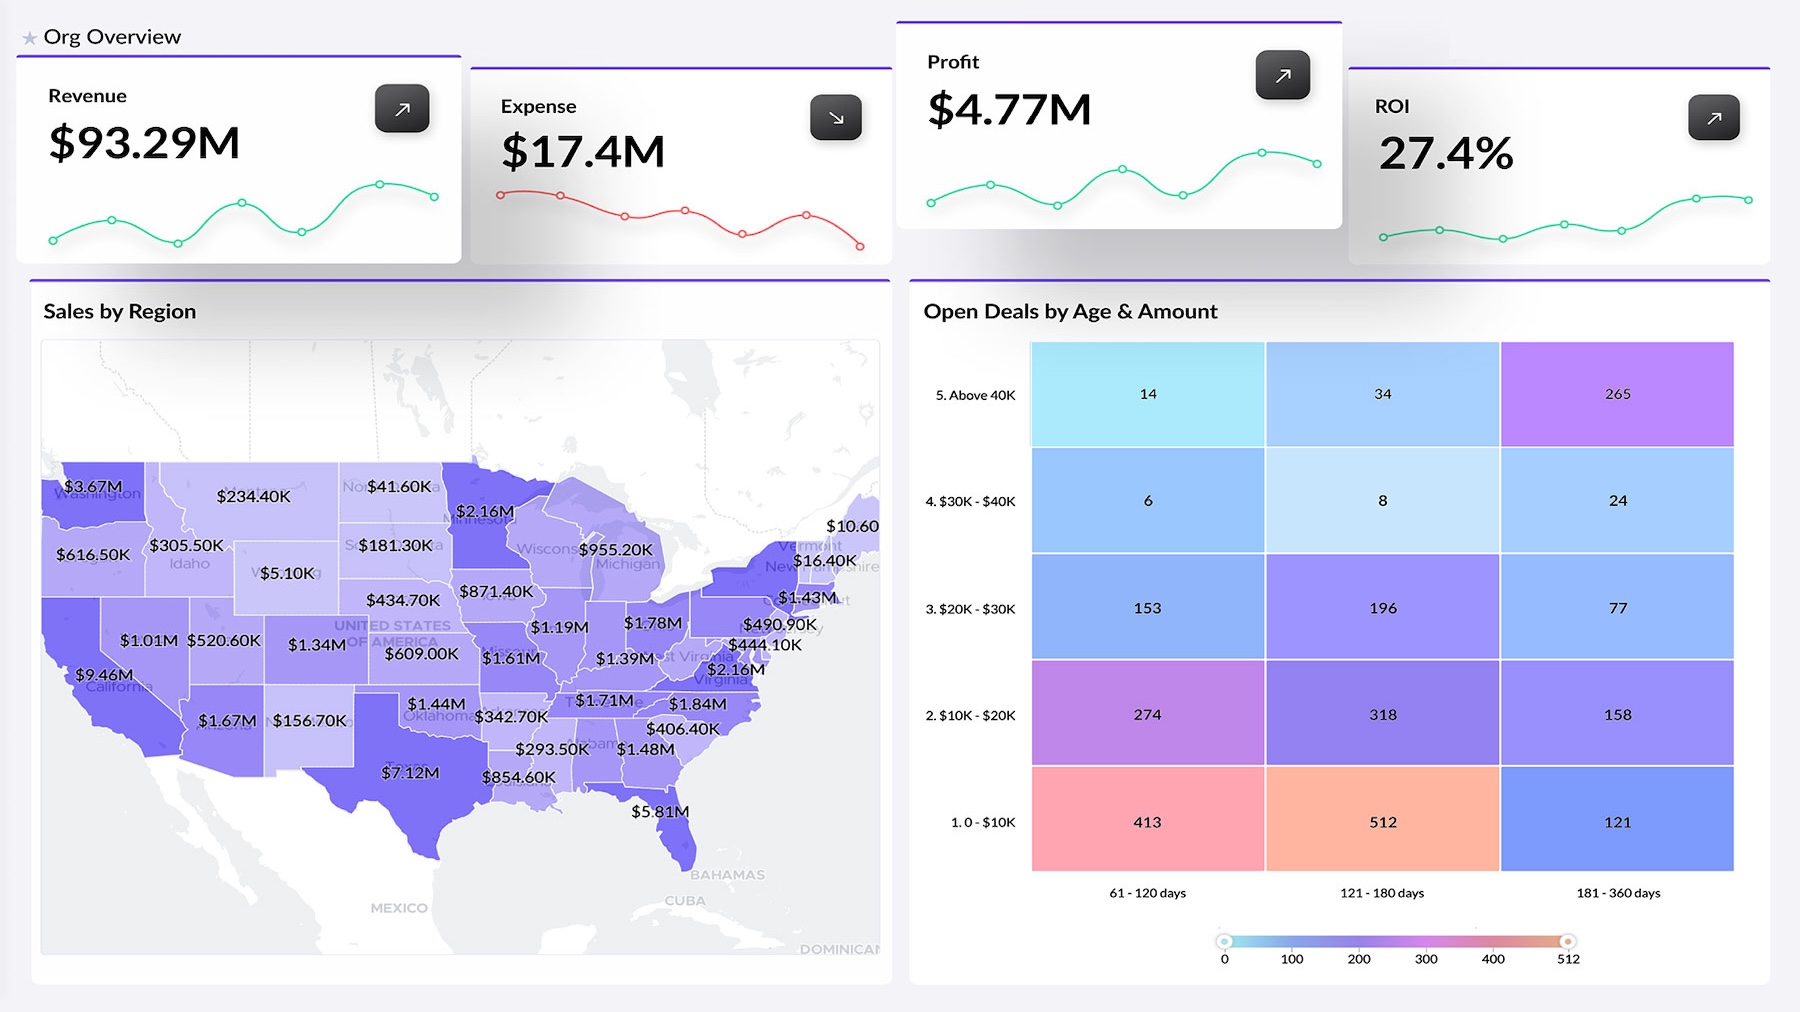
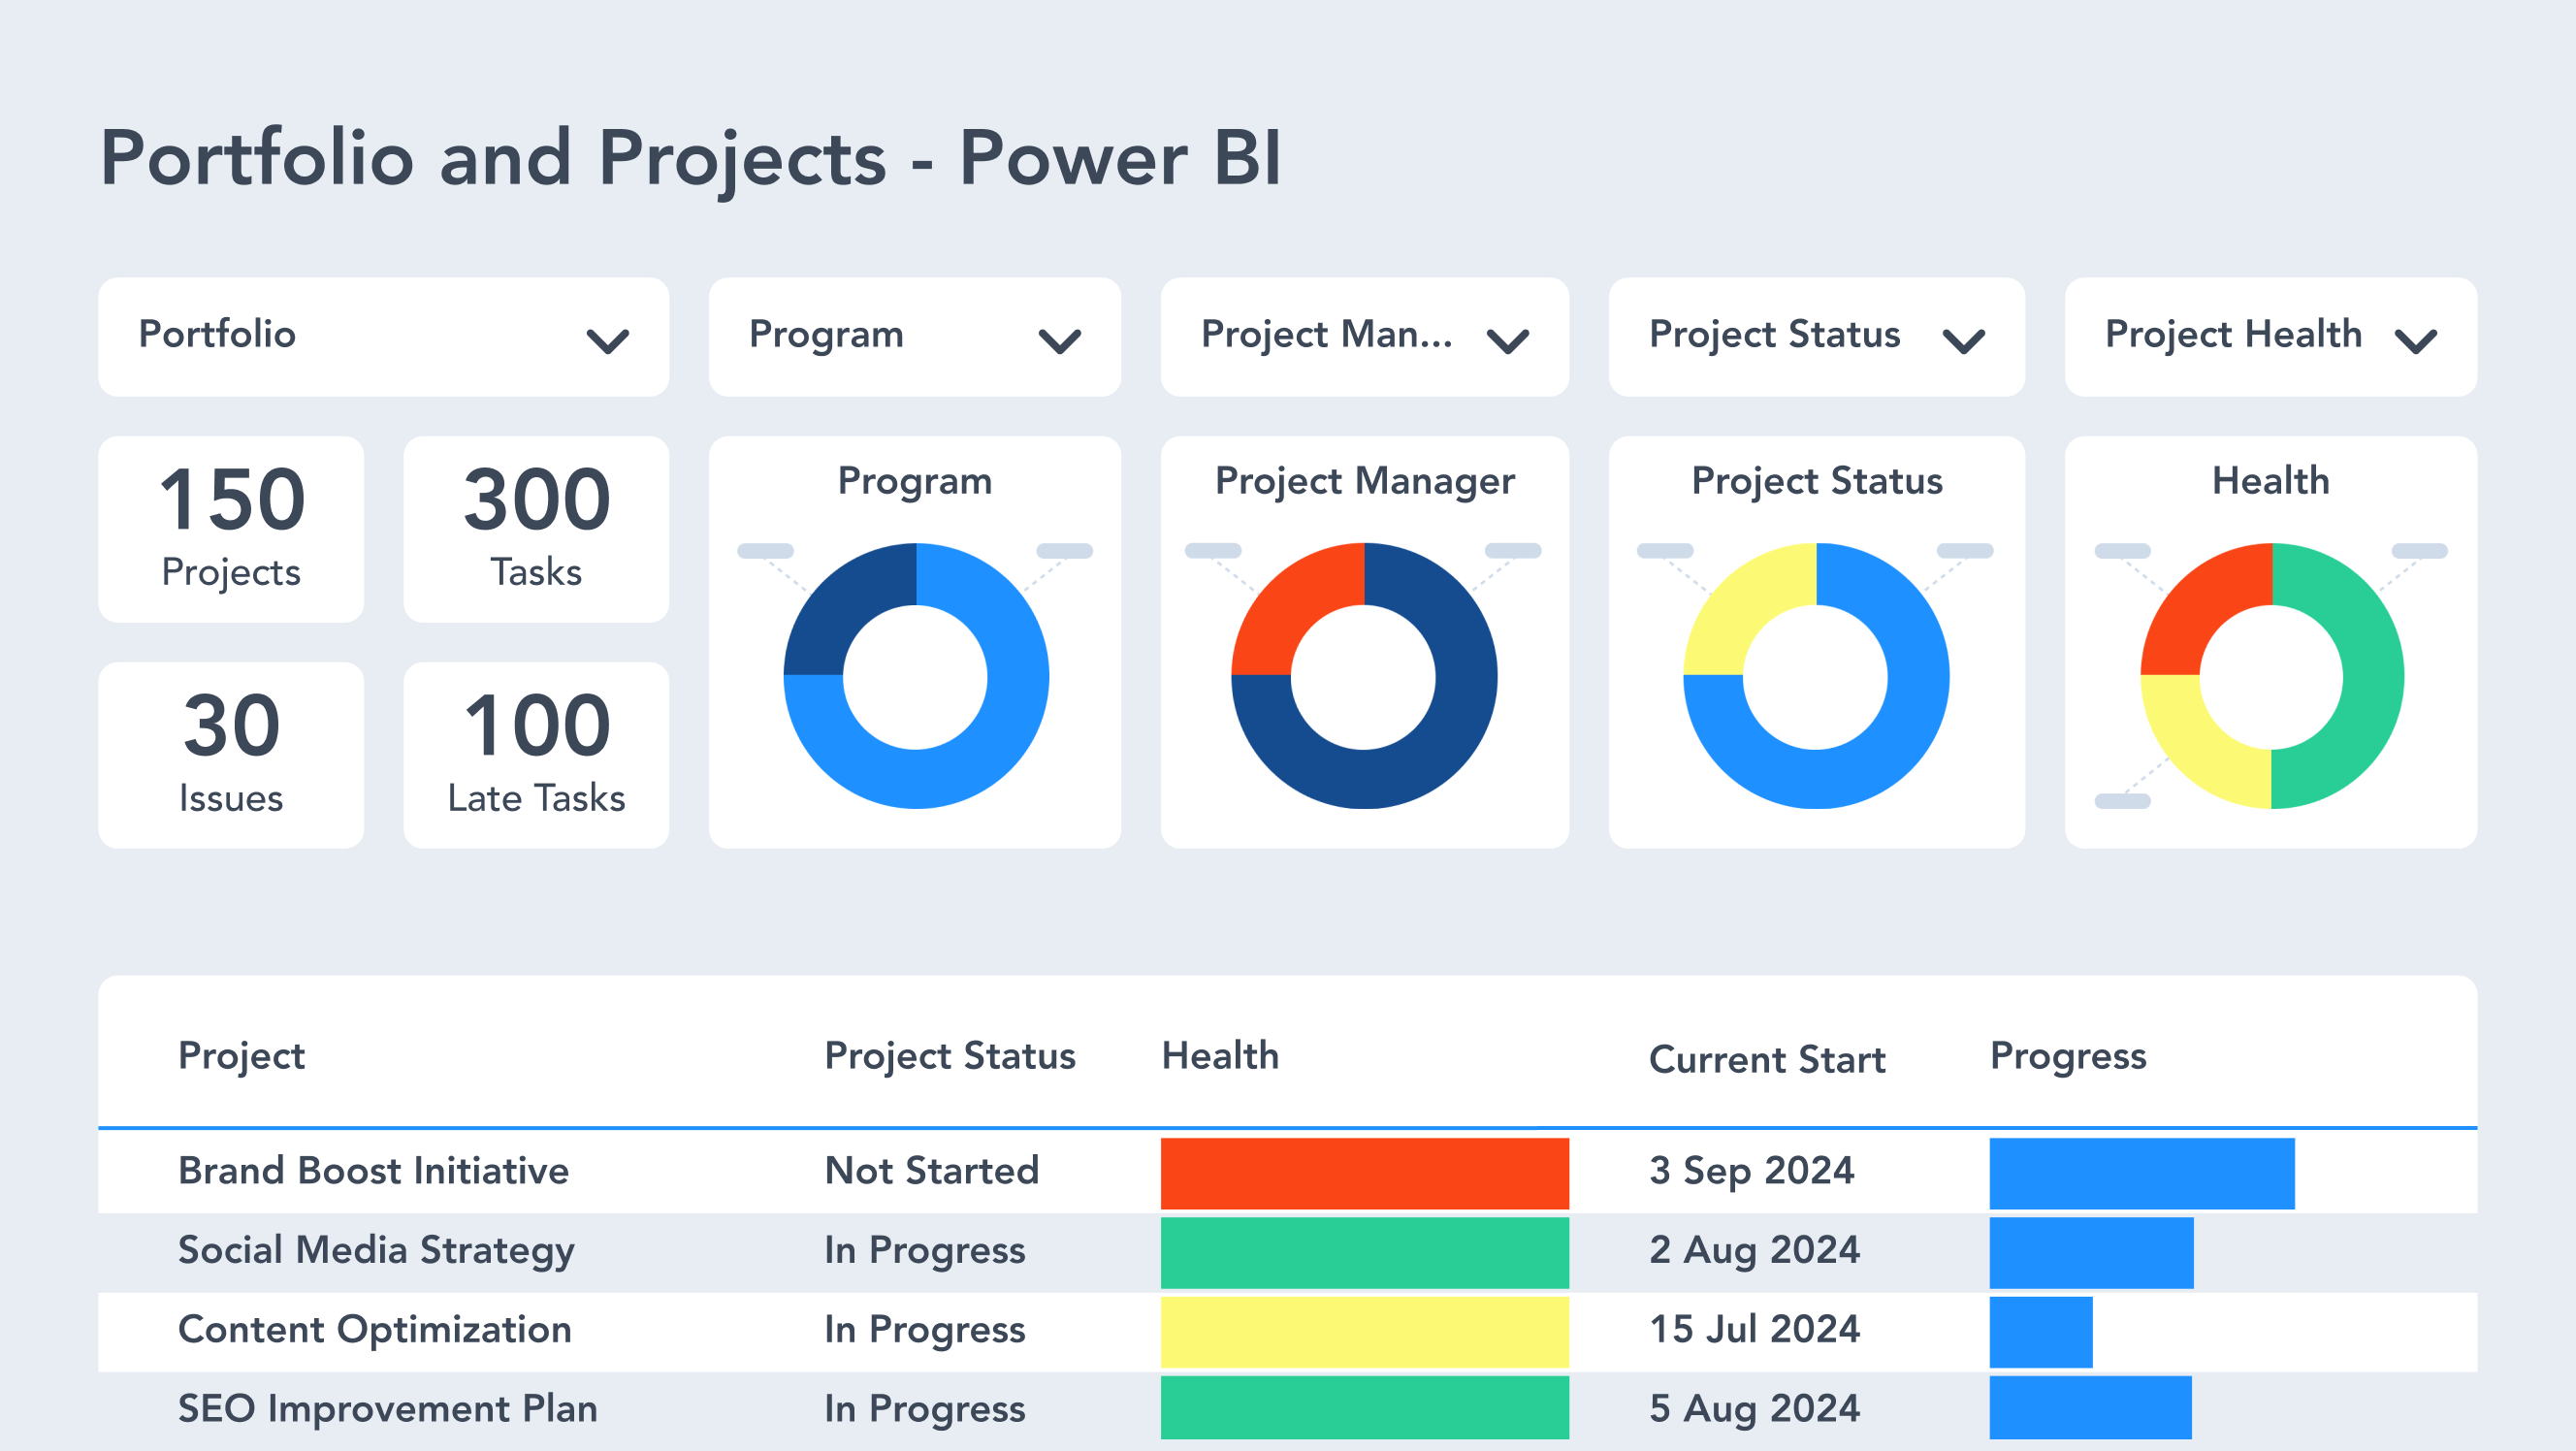
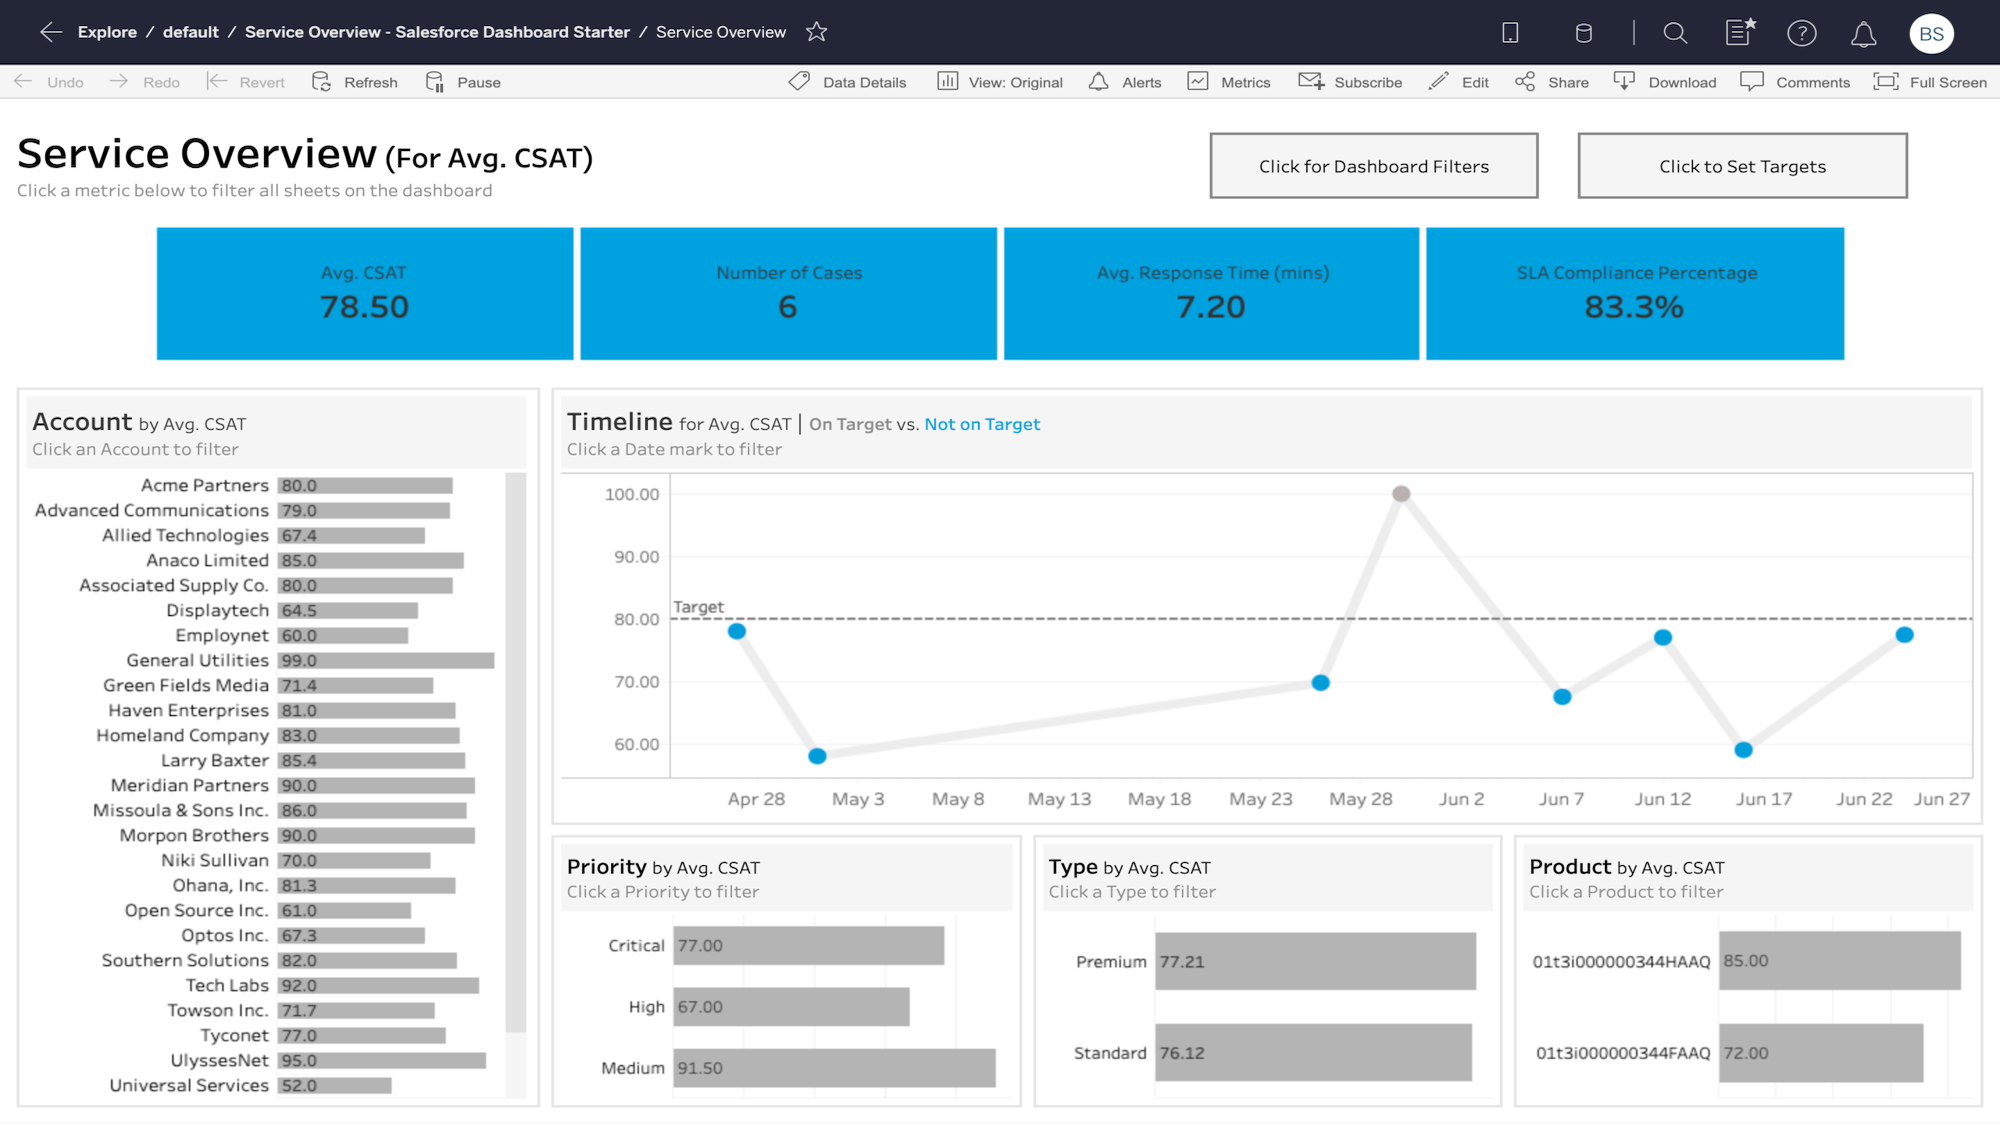
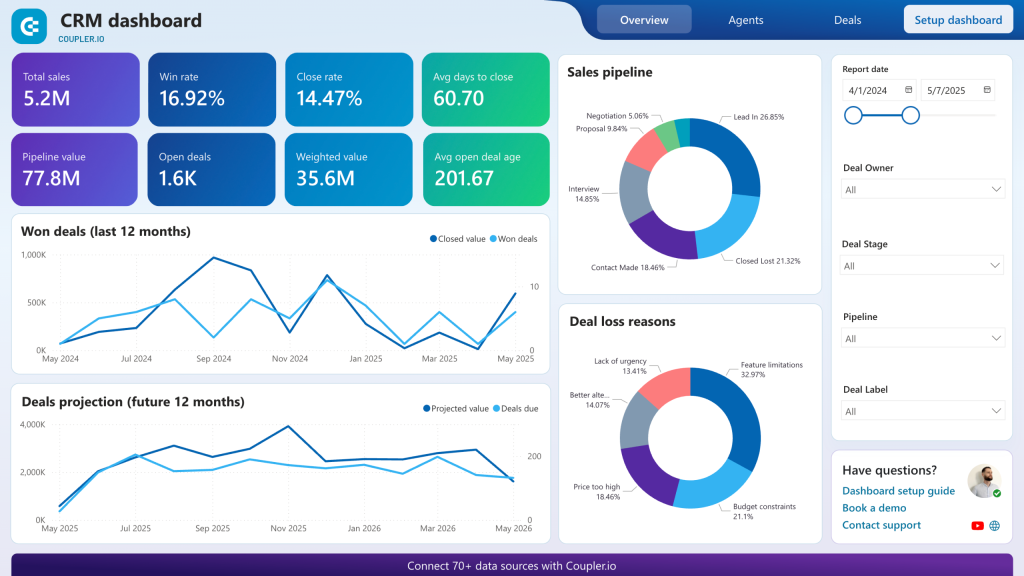
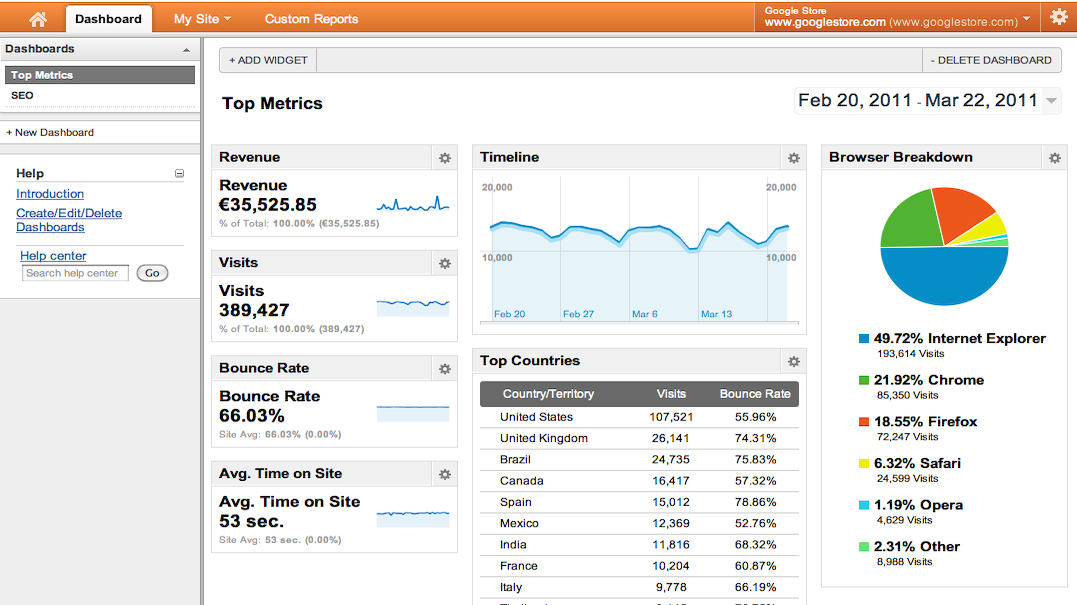
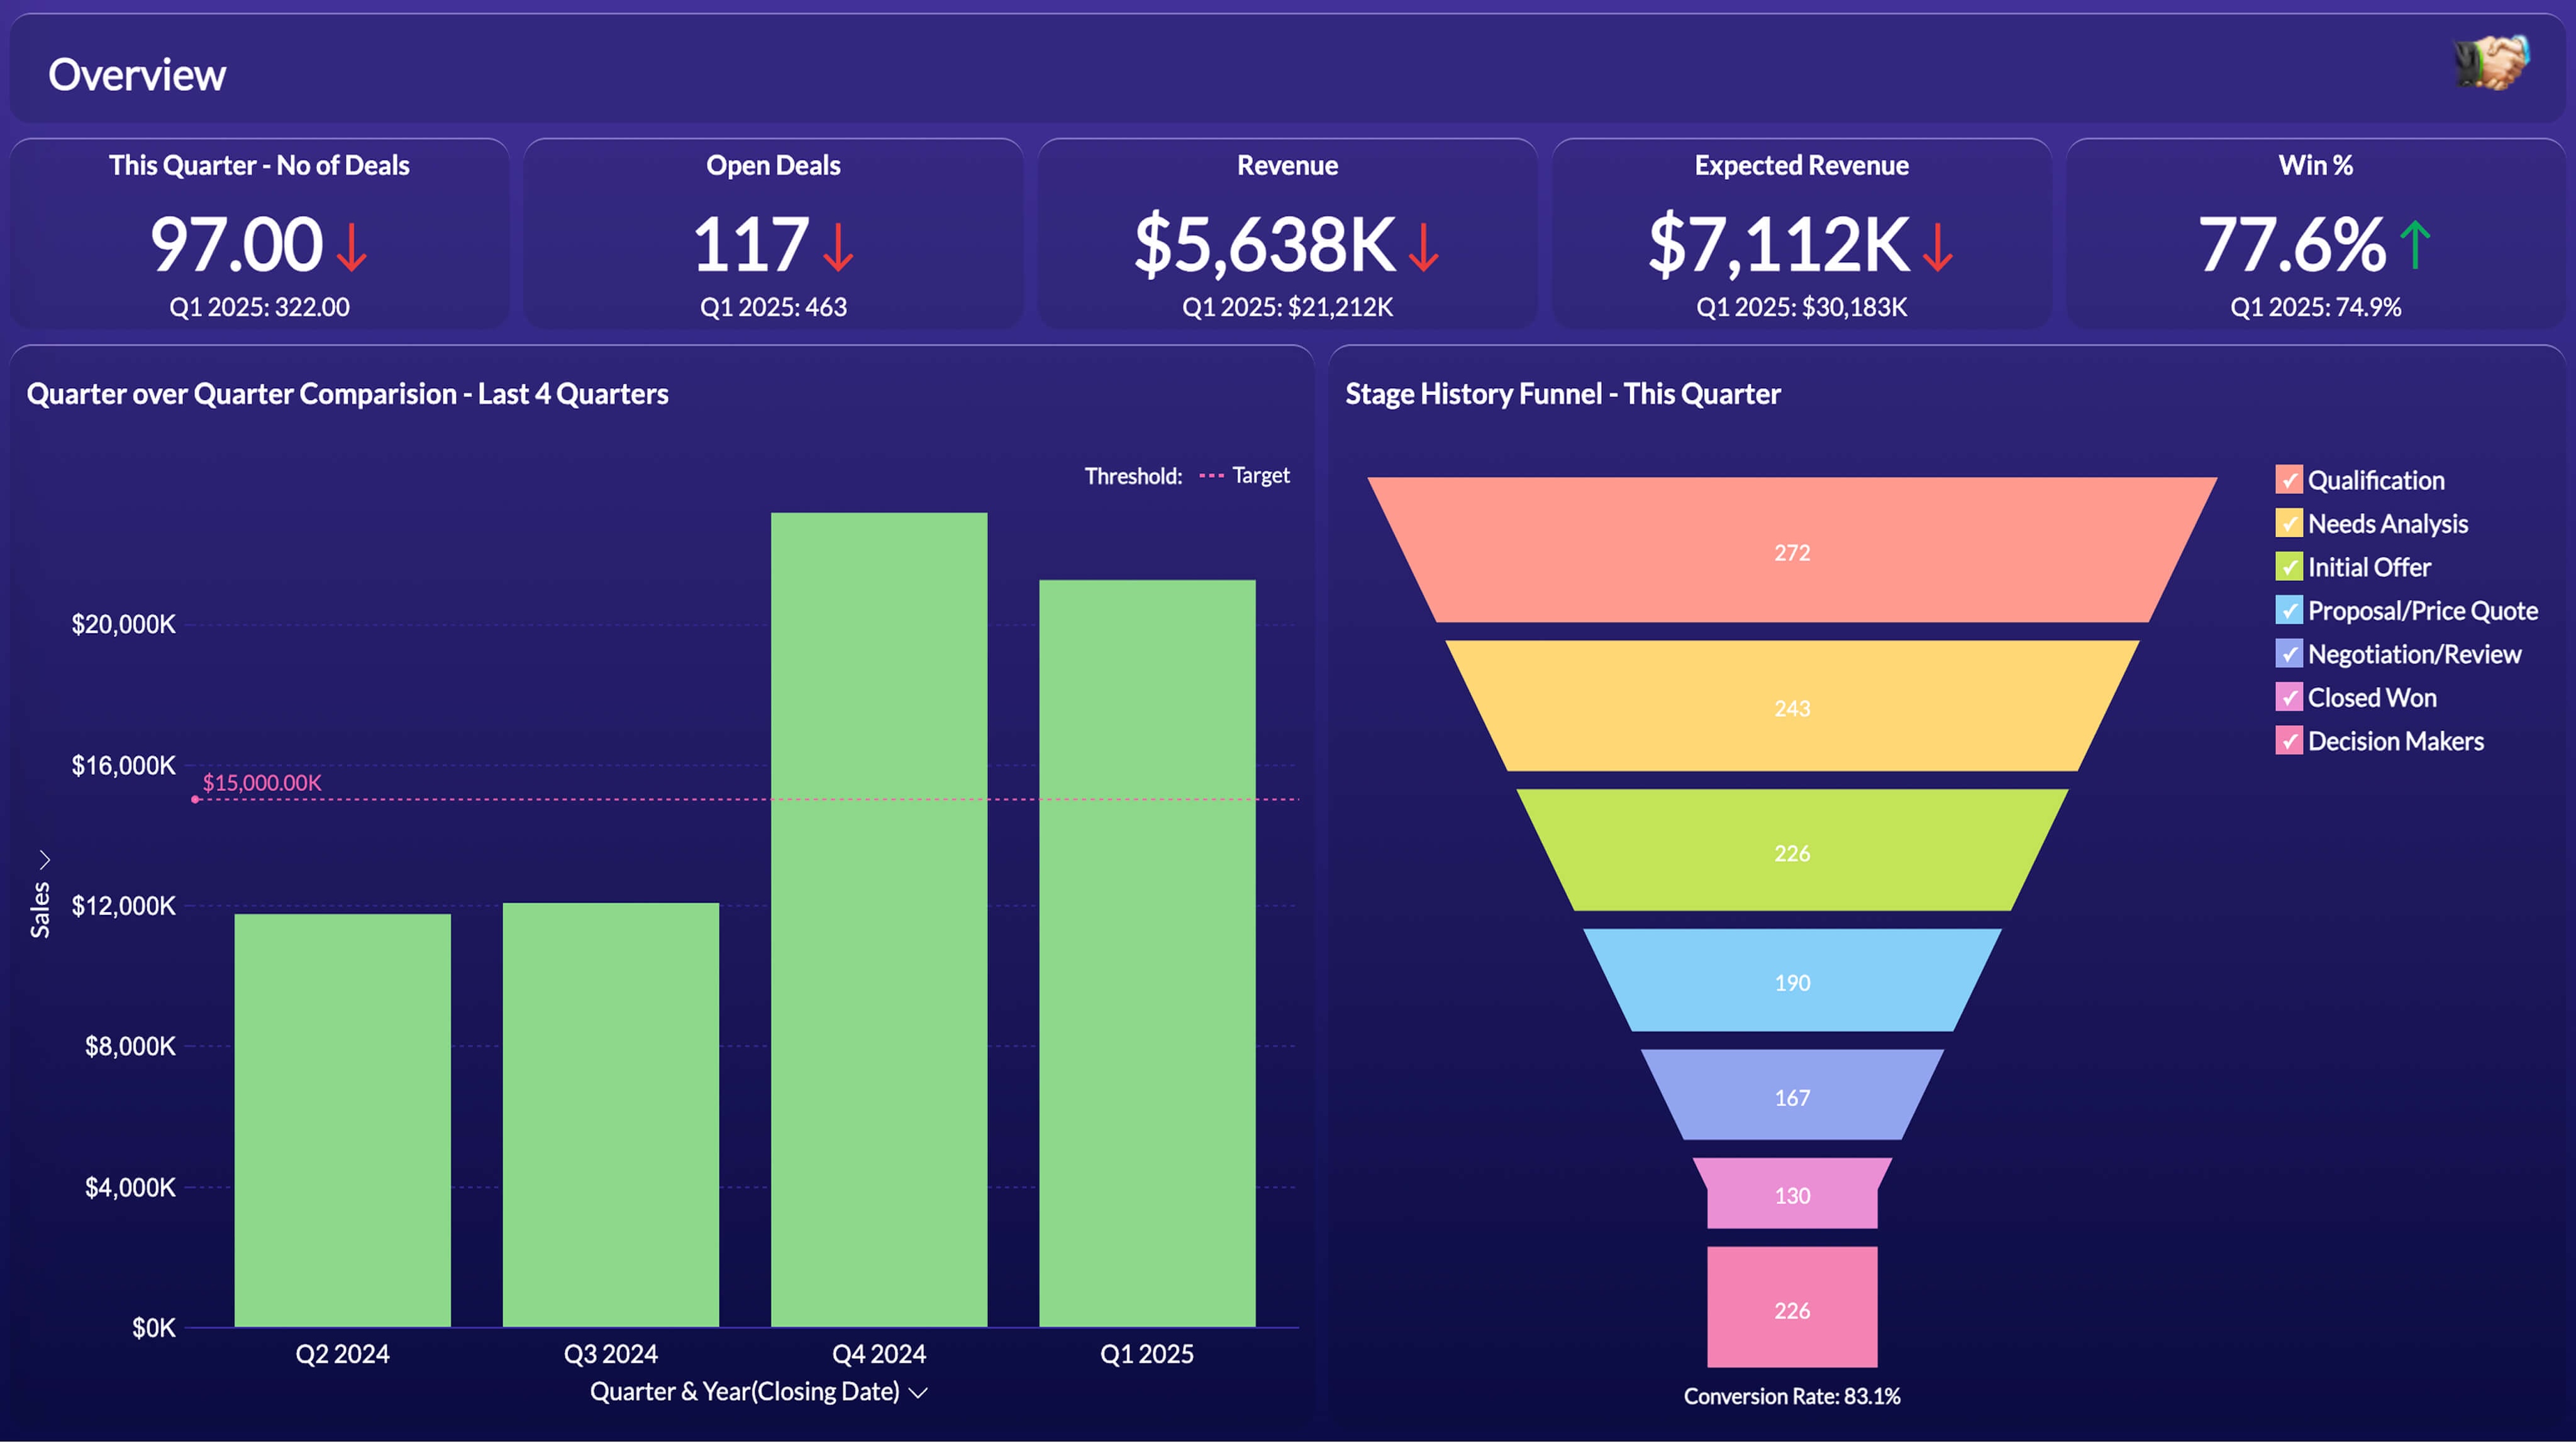
No more one-size-fits-all reports. We design dashboards that fit the way you operate—highlighting key performance indicators (KPIs), customer behavior, sales pipelines, and operational efficiency. Whether you're tracking monthly revenue or real-time inventory, your data becomes a tool—not a task.

Every dashboard is designed with your team in mind—executives get high-level overviews, managers see operational details, and analysts access deep-dive capabilities. Interactive filters, drill-down features, and customizable views ensure everyone gets the insights they need, when they need them.

Automated Reports icon

Automated Reports

Scheduled reporting delivered straight to your team.

Say goodbye to manual report generation. Our automated reporting systems gather, process, and distribute customized reports on your schedule—daily, weekly, monthly, or triggered by specific events. Reports are delivered via email, Slack, or your preferred platform, formatted exactly how you need them.

From executive summaries to detailed performance breakdowns, automated reports keep your team informed without the overhead. We include intelligent alerting that notifies stakeholders when key metrics cross thresholds, ensuring critical issues never go unnoticed.

Data Warehousing icon

Data Warehousing & ETL

Consolidate data sources into a clean, query-ready structure.

Your data lives in multiple places—CRM systems, databases, spreadsheets, third-party platforms. We build ETL (Extract, Transform, Load) pipelines that automatically collect data from all your sources, clean and standardize it, and load it into a centralized data warehouse optimized for analysis.

Once centralized, your data becomes exponentially more valuable. Cross-reference customer behavior with sales trends, correlate marketing campaigns with revenue, and discover insights that only emerge when all your data speaks the same language. Our data warehouses are built on scalable cloud infrastructure, handling everything from gigabytes to petabytes of information.

Predictive Analytics icon

Predictive Analytics

Spot trends before they happen using ML-enhanced forecasting.

Don't just understand what happened—anticipate what's coming. Our predictive analytics solutions use machine learning to forecast future trends based on historical patterns. Predict customer churn, inventory needs, sales performance, and market shifts with confidence.

We build custom forecasting models trained on your specific business data, accounting for seasonality, market conditions, and unique variables that impact your operations. These models continuously learn and improve, becoming more accurate over time as they process new data.

Visualization Tools icon

Visualization Tools

Clean, intuitive graphs and charts that tell compelling stories.

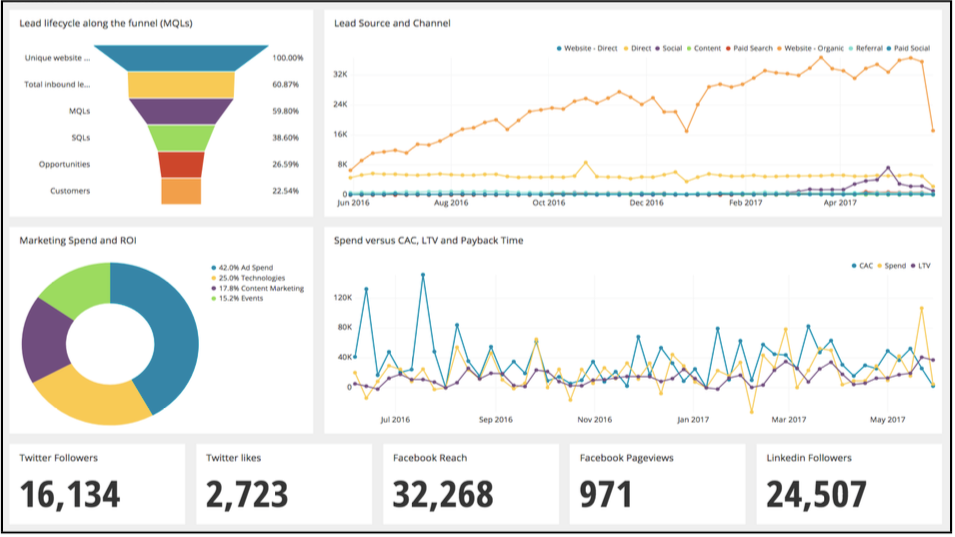
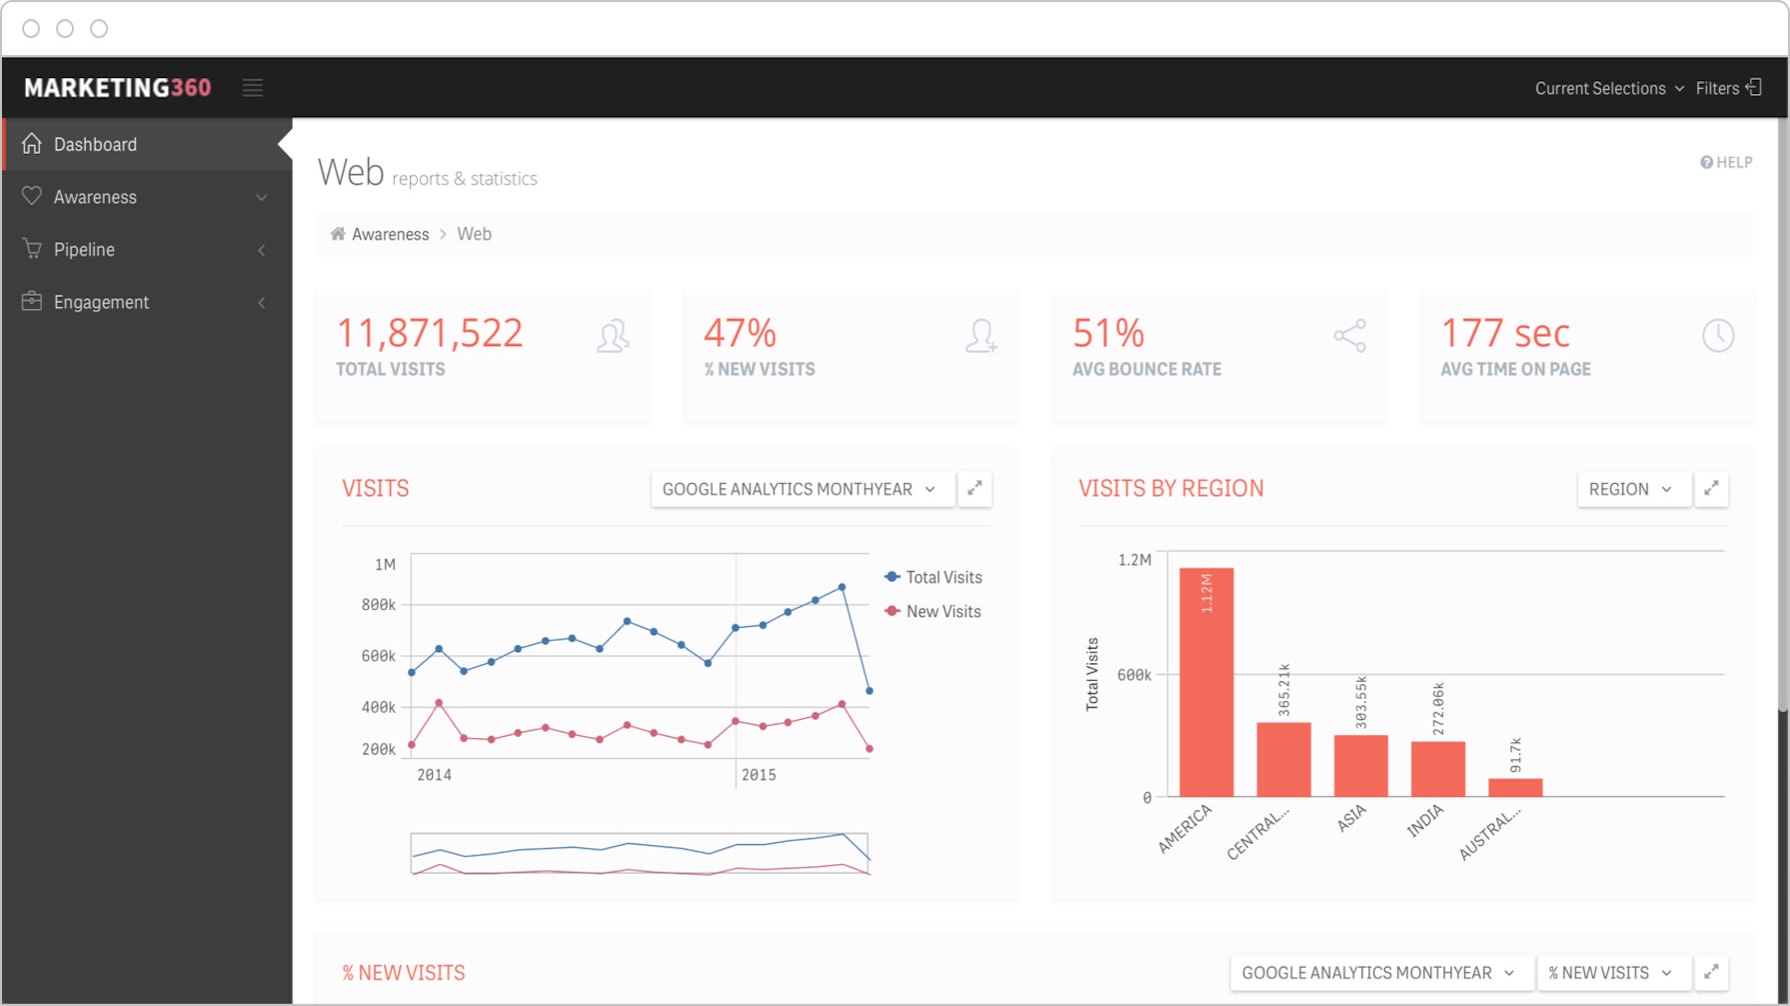
Numbers tell stories, but visualizations bring them to life. We design beautiful, intuitive charts, graphs, and visual representations that make complex data immediately understandable. From simple bar charts to sophisticated geospatial visualizations, we choose the right visualization for your data type and audience.

Our visualizations are interactive and responsive, adapting seamlessly to desktop, tablet, and mobile devices. Users can explore data at their own pace, switching between views, filtering by criteria, and exporting insights in multiple formats for presentations and reports.
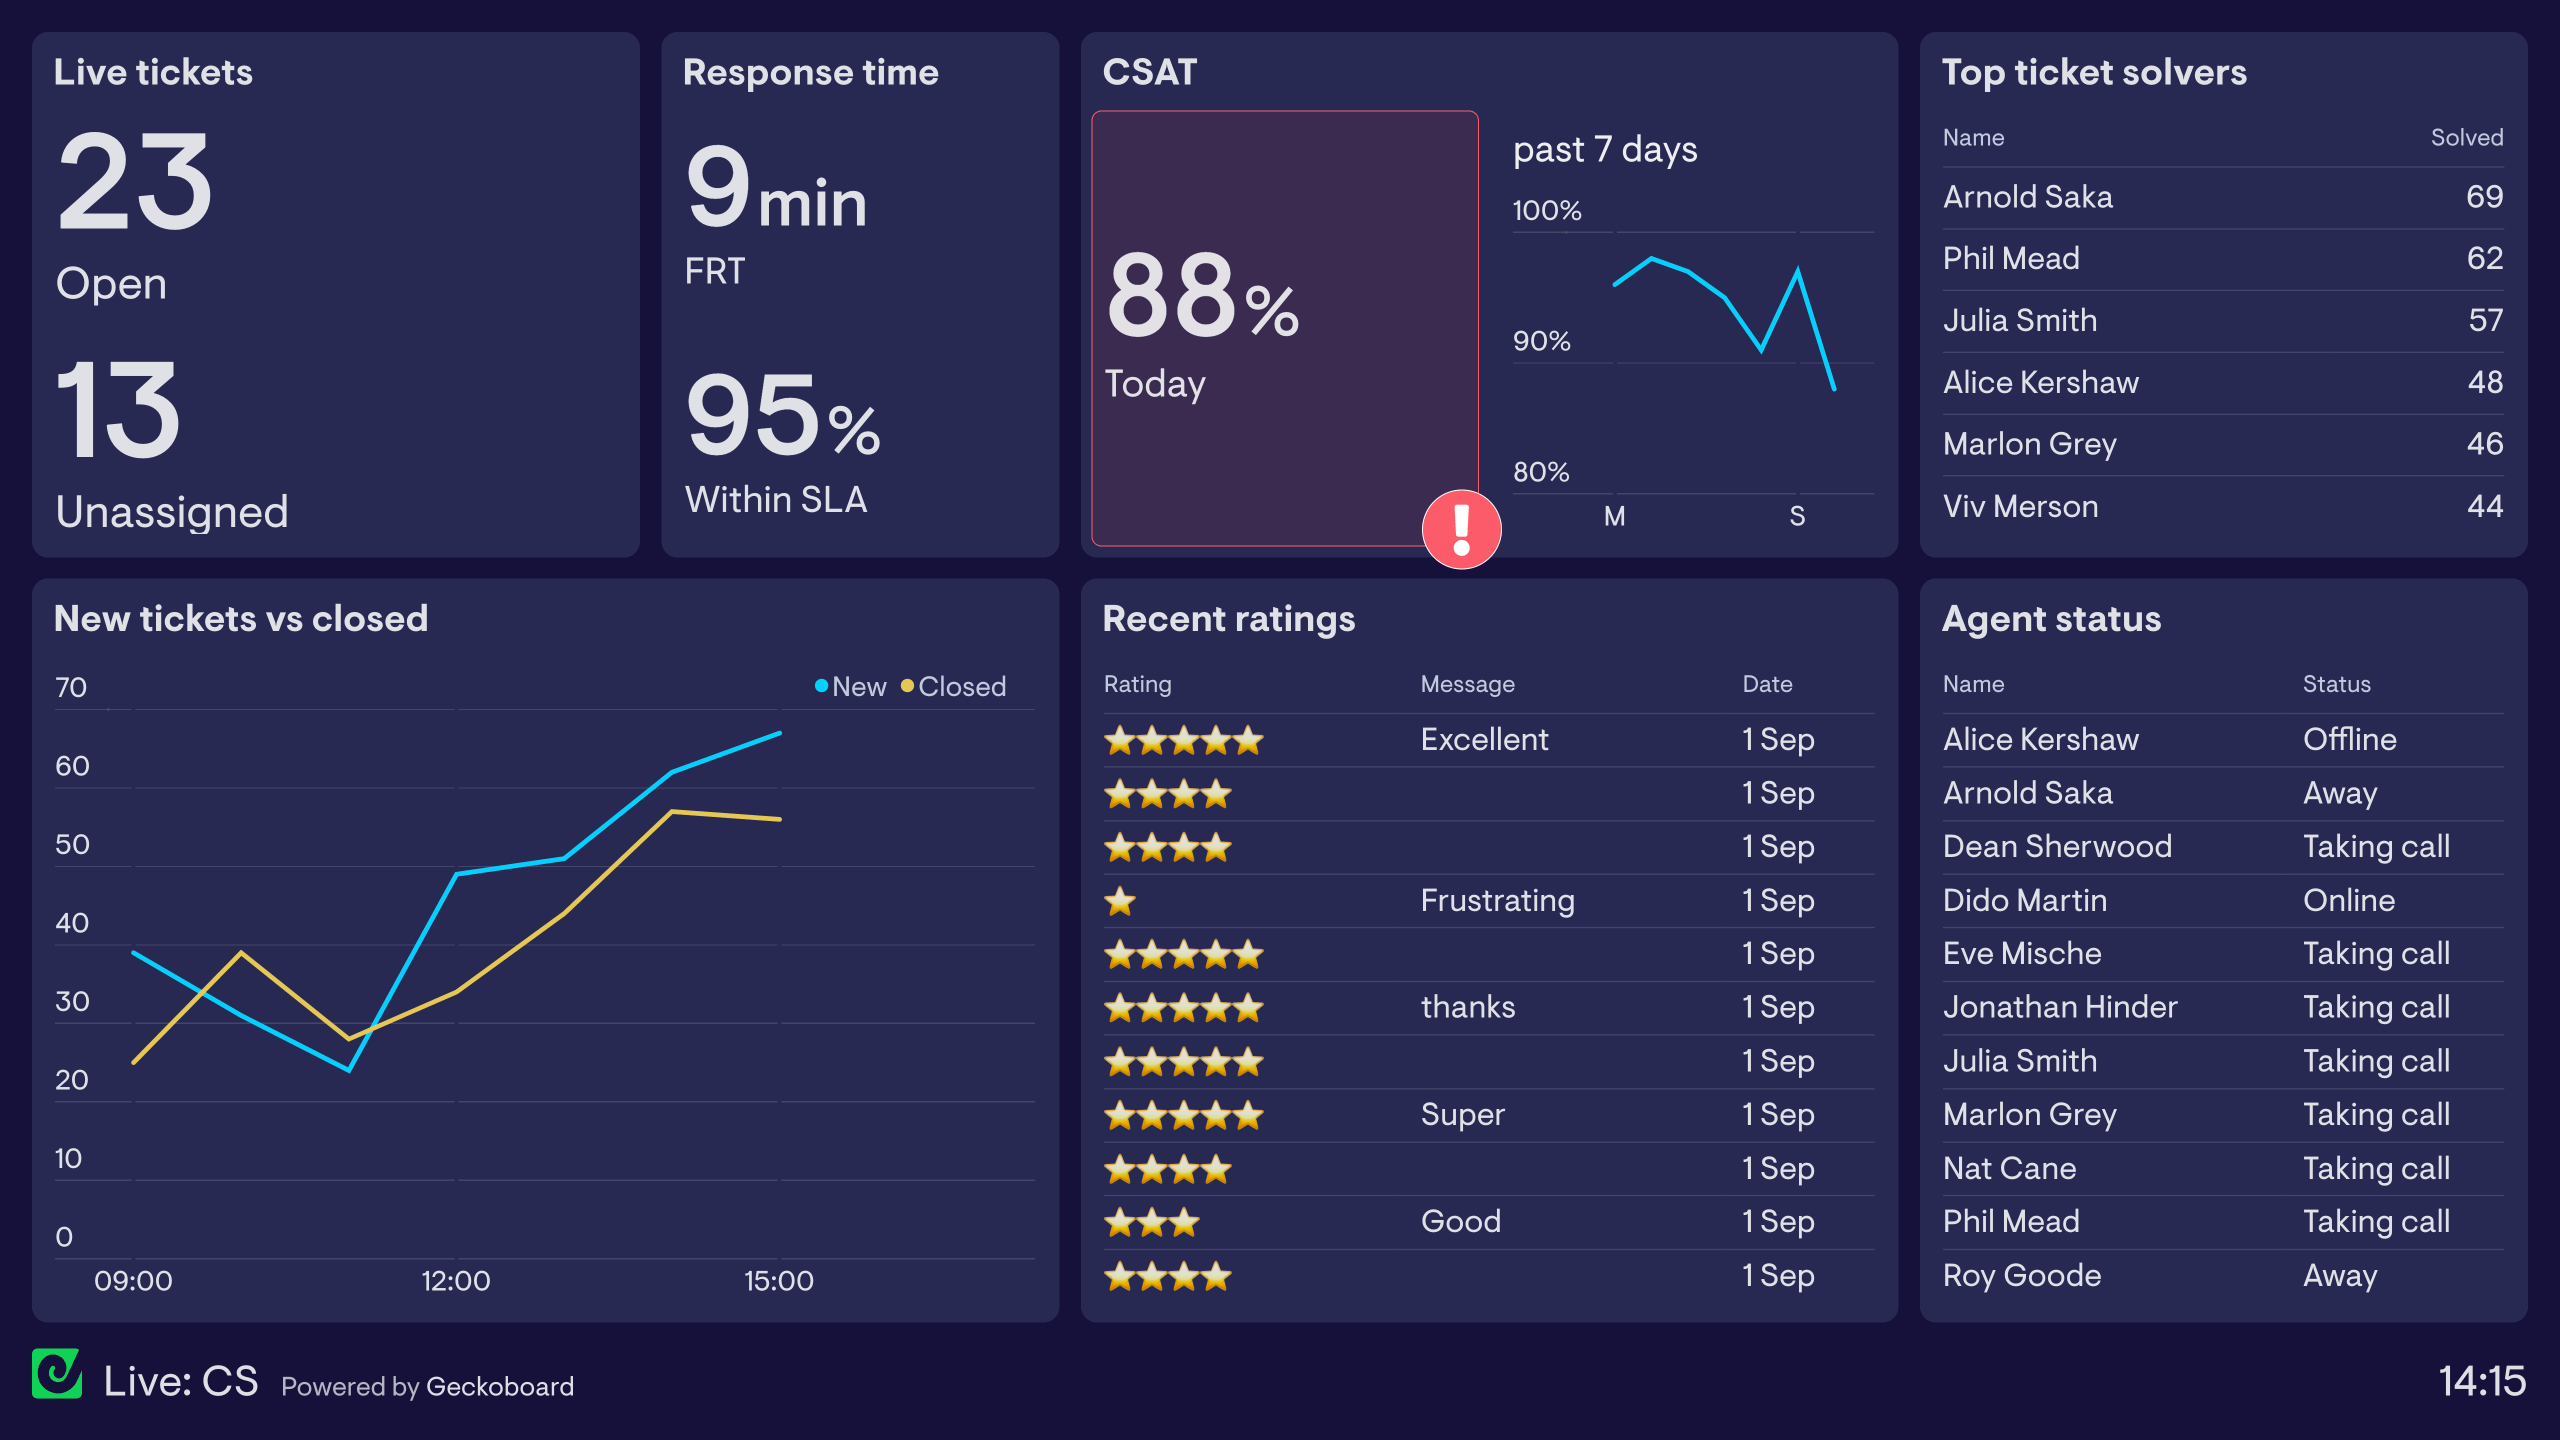
From data chaos to data clarity.

Every analytics project follows a structured process designed to ensure your dashboards and reports deliver real business value from day one.

Data Analytics Process Timeline - Discovery, Design, Development, Testing, Launch

Understanding your data landscape, KPIs, and reporting needs.

We begin by mapping out your entire data ecosystem—where your data lives, how it's structured, and what business questions you need answered. Through stakeholder interviews and system audits, we identify the metrics that matter most to your organization.

  • Data source inventory and quality assessment
  • KPI definition and business objective alignment
  • User role analysis and access requirements
  • Current reporting workflow evaluation
  • Deliverable: Data strategy document + KPI framework

Designing intuitive interfaces that make complex data instantly understandable.

Our designers create dashboard mockups that prioritize clarity and usability. We choose the right visualizations for each data type, organize information hierarchically, and design interactive flows that let users explore data naturally.

  • Information architecture and layout design
  • Visualization type selection (charts, graphs, maps, tables)
  • Interactive prototype development
  • User testing and design refinement
  • Deliverable: Interactive dashboard prototype

[Insight Journey Diagram: Stylized flow showing data input → processing → dashboard → decision. Icons representing cloud storage, AI, charts, and a person marking a decision board.]

Building robust ETL processes and data infrastructure.

We develop automated data pipelines that extract information from all your sources, transform it into a standardized format, and load it into your analytics platform. These pipelines run on schedule or in real-time, ensuring your dashboards always reflect current data.

  • ETL pipeline architecture and development
  • Data cleaning, validation, and transformation
  • Integration with CRM, ERP, and third-party systems
  • Data warehouse setup and optimization
  • Deliverable: Production data pipelines + documentation

[Integration Illustration: Abstract illustration of interconnected platforms (clouds, databases, apps) feeding into a central analytics hub—conveying security, real-time sync, and automation.]

Building interactive dashboards with powerful analytics capabilities.

Using tools like Tableau, Power BI, or custom web applications, we build your dashboards exactly as designed. We implement drill-down capabilities, filtering, user permissions, and export features—everything your team needs to extract insights efficiently.

  • Dashboard development using chosen platform
  • Interactive features and filtering implementation
  • Role-based access control configuration
  • Mobile responsiveness and cross-device optimization
  • Deliverable: Fully functional analytics dashboard

Empowering your team to leverage data for better decisions.

We provide comprehensive training to ensure your team can confidently use the new analytics tools. From basic navigation to advanced analysis techniques, we make sure everyone understands how to extract value from the dashboards.

  • User training sessions for all stakeholder groups
  • Documentation and video tutorials
  • Admin training for dashboard maintenance
  • Ongoing support and optimization
  • Deliverable: Deployed analytics platform + training materials

SECURE, SCALABLE, AND INTEGRATED

Built to Grow
With Your Business

  • Seamless System Integration: We integrate with your existing systems—CRM, ERP, e-commerce, marketing platforms—bringing all your data into one coherent picture without disrupting current workflows.
  • Real-Time Data Updates: See your business as it happens with real-time data feeds and live dashboard updates. No more waiting for batch processing or overnight refreshes.
  • Enterprise-Grade Security: Your data is protected with industry-standard encryption, role-based access controls, and audit logging. We comply with GDPR, CCPA, and other data protection regulations.
  • Scalable Cloud Infrastructure: Our analytics solutions are built on scalable cloud platforms that grow with your data volume. Start small and scale effortlessly as your business expands.
  • Mobile-Responsive Design: Access your dashboards anywhere, on any device. Our responsive designs adapt beautifully to desktop, tablet, and mobile screens.
  • Custom Alerts & Notifications: Stay informed with intelligent alerts that notify you when metrics cross thresholds or anomalies are detected. Never miss a critical business event.

Data-Driven by Design

Every analytics solution is built with scalability and security in mind. We future-proof your stack so it grows as you do—delivering insights that drive strategic moves with confidence.

Transparent Pricing for Analytics Solutions

Choose the plan that fits your analytics needs. All plans include dedicated support, training, and the quality you expect from custom data solutions.

STARTER

from $699

  • Static dashboard from CSV or spreadsheet
  • Embedded visualizations (charts, tables)
  • Basic filtering and exports
  • Google Sheets or Excel integration

ENTERPRISE

from $9,999

  • Business Intelligence platform
  • Data lake or warehouse integration
  • Forecasting, anomaly detection, or ML pipelines
  • Custom access levels, compliance-ready exports

All plans include user training and documentation. Custom requirements? .

Make Smarter Moves with CYBERCUBE Analytics

Your business doesn't need more data—it needs better answers. Let's build the tools that uncover them.

What You Get When You Work With Us

  • Free Initial Consultation: We'll analyze your current data landscape and identify opportunities for better insights and decision-making.
  • Transparent Pricing: Clear project estimates with detailed breakdowns. You'll know exactly what you're getting and what it costs before we begin.
  • Expert Data Team: Analytics specialists, data engineers, and visualization experts dedicated to transforming your raw data into actionable insights.
  • Comprehensive Training: We don't just deliver dashboards—we empower your team to use them effectively with thorough training and documentation.
  • Ongoing Support: From optimization to new feature development, we provide continuous support to ensure your analytics platform evolves with your business.

What Happens Next?

1

Discovery Call

We'll schedule a call to understand your data sources, key metrics, and analytics objectives.

2

Proposal & Roadmap

Receive a detailed proposal with dashboard mockups, pricing, data architecture, and project timeline.

3

Design & Build

Once approved, we jump into development with regular demos and feedback sessions throughout.

CYBERCUBE 100% Satisfaction Promise Warranty

Ready to Turn Data Into Decisions?

Let's talk data and build analytics that drive your business forward. Contact us to get started.

Or email us directly at contact@cybercube.software