Interactive Dashboards
Custom-built interfaces tailored to your KPIs and roles.

Service
See what your data is telling you.
We turn raw data into dashboards, reports, and forecasts your team actually opens — so decisions come from the numbers, not from whoever compiled the spreadsheet last.
Start your project →Why it fits
Dashboards fail when they show everything and answer nothing. We start from the questions you ask every week and build backward — clean pipelines, live numbers, and views sized to each role.

What we build
Custom-built interfaces tailored to your KPIs and roles.
Scheduled reporting delivered straight to your team.
Consolidate data sources into a clean, query-ready structure.
Spot trends before they happen using ML-enhanced forecasting.
Clean, intuitive graphs and charts that tell compelling stories.
Our process
Understanding your data landscape, KPIs, and reporting needs.
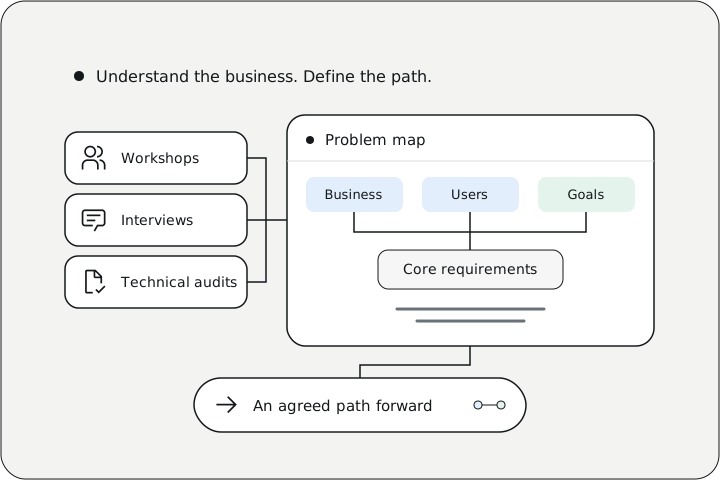
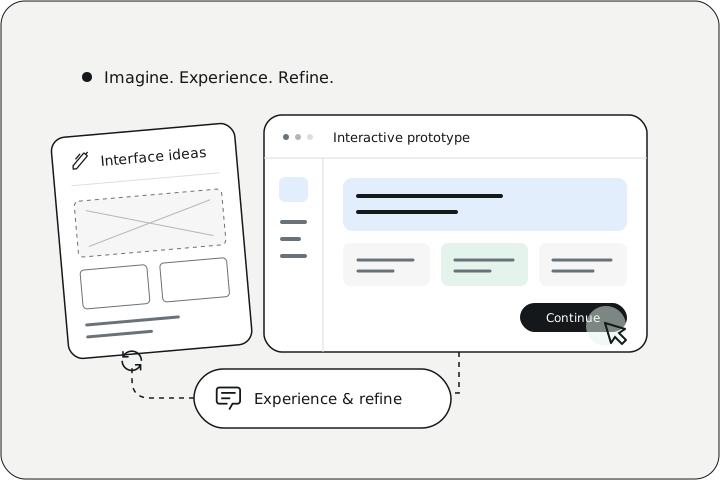
Designing intuitive interfaces that make complex data instantly understandable.
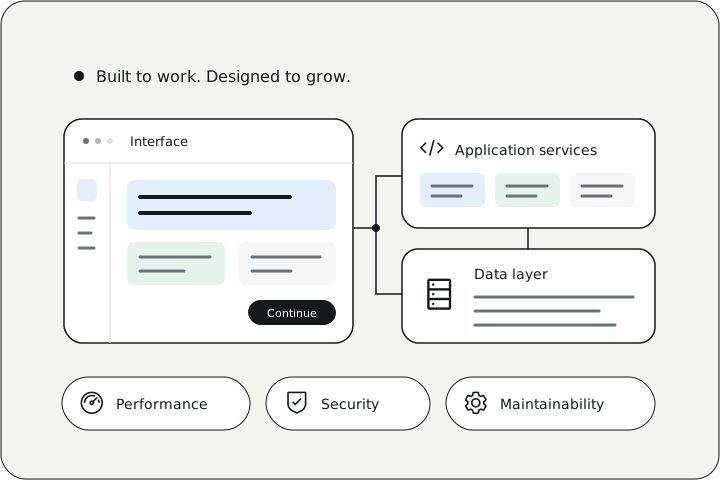
Building robust ETL processes and data infrastructure.
Building interactive dashboards with powerful analytics capabilities.
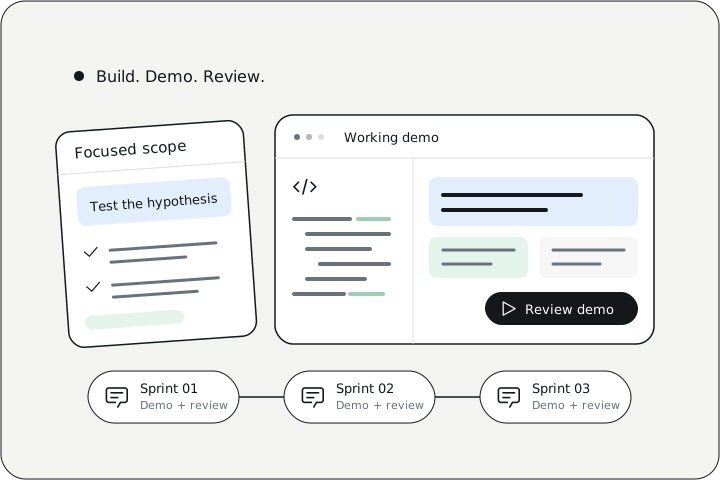
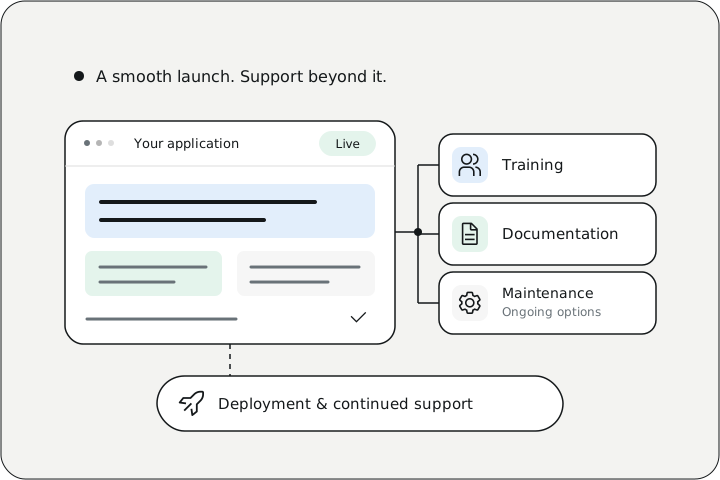
Empowering your team to leverage data for better decisions.
What you get
Databases, SaaS tools, and APIs pulled into one clean, query-ready structure, so the numbers come from everywhere they live — not a manual export.
Real-time pipelines keep dashboards current, so decisions run on what is happening now instead of whoever refreshed the spreadsheet last.
Role-based access, encryption, and audit trails built in, so the right people see the right data and nothing leaks past them.
Cloud architecture that handles more data, more sources, and more users as you grow, without a rebuild when the load climbs.
Custom thresholds notify the right people the moment a number moves, so issues surface as alerts instead of a chart nobody opened.
Tell us what you need to see and decide. We'll reply within one business day — no pressure, no sales script.
Start your project →Answer a few quick things and the right person gets back to you within one business day — with a plan, a fixed quote, or a prototype to click through.
Ask about our work, services, or how we'd approach your project.
Hi, I'm Ping — CYBERCUBE's assistant. Tell me what you're trying to build or fix, and I'll point you the right way, or connect you with the team.
Prefer a human? or email [email protected].