
Case study · Data
Forecasting Warehouse.
A warehouse with forecasting and anomaly alerts
We built a central warehouse that fed forecasting and anomaly detection — so a business could see where trends were heading and catch problems before they showed up in a monthly report.
Start your project →- Industry
- Data & analytics
- What we built
- 3 integrated components
- Key outcome
- 1 store For all the data
Overview
Seeing problems before the report does.
A business had outgrown dashboards — it could see what had happened, but not where things were heading, and problems surfaced weeks late in a monthly review.
They wanted a central store of their data that could forecast trends and flag anomalies as they happened.
- Dashboards showed the past, not the trend ahead
- Problems surfaced late, in the monthly report
- Data spread across systems with no single store
- No way to get alerted when something looked off
The goal was a central warehouse feeding forecasting and anomaly alerts, where the history supported it.
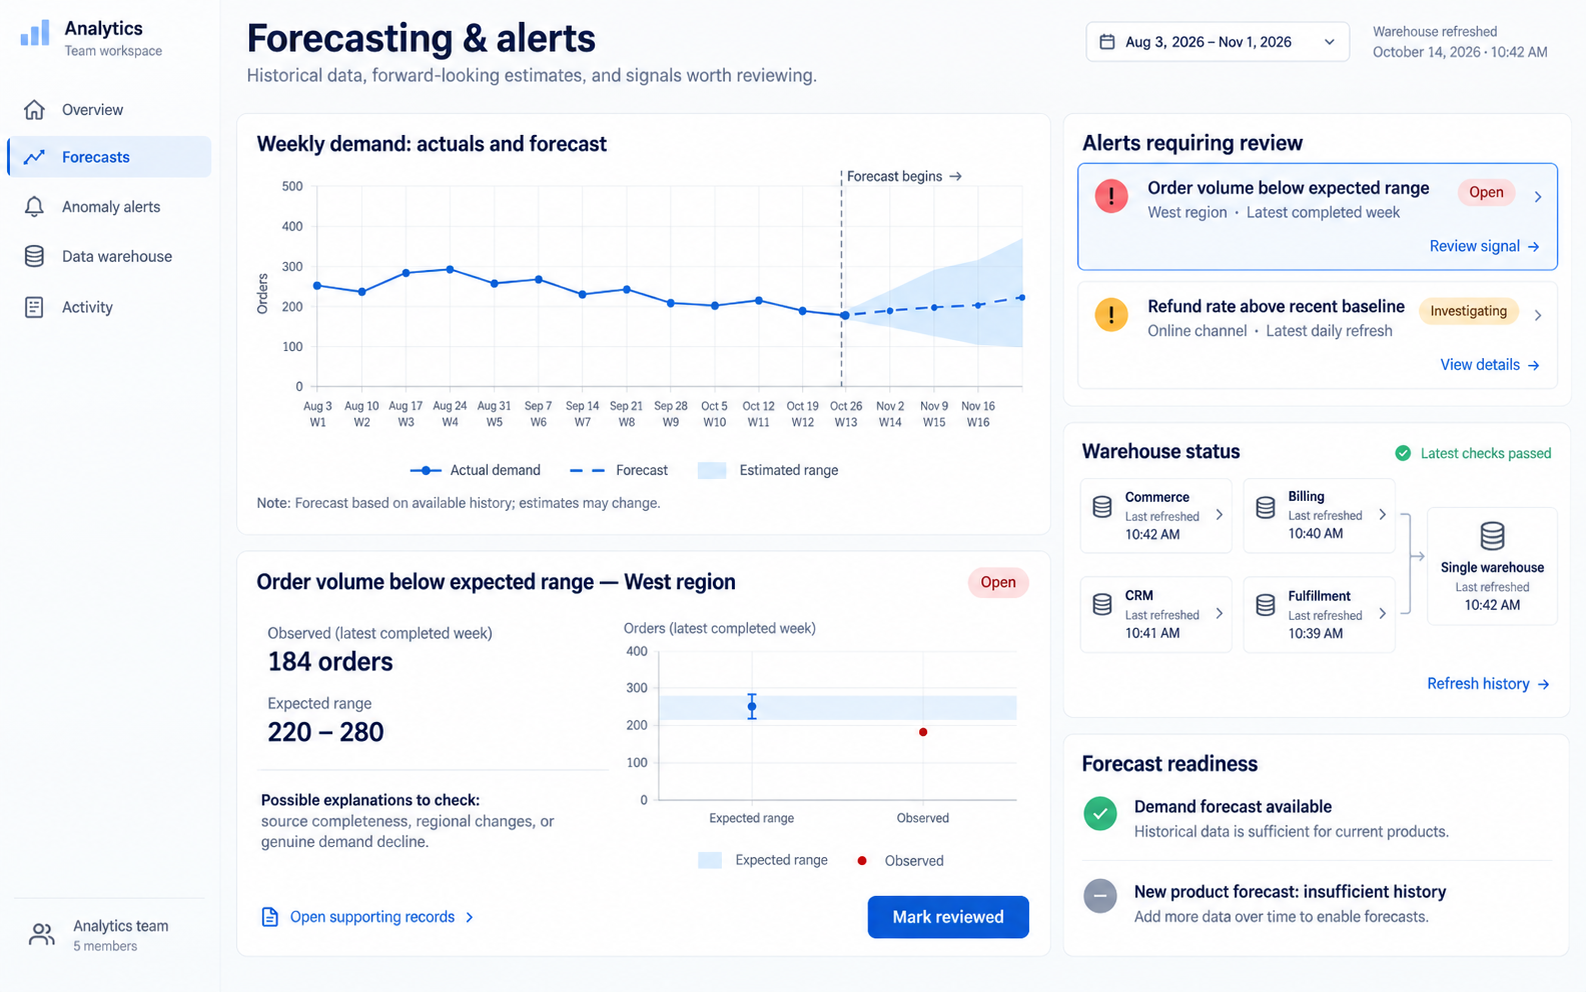
Experience flow
From scattered data to forecasts and alerts.
The solution
A warehouse that predicts and alerts.
We built a central warehouse feeding forecasting and anomaly detection — predictions and alerts where the history supported them, with controls on access and exports.
Core components
One store of truth, predictive signal on top, and governed access to it.
-
01
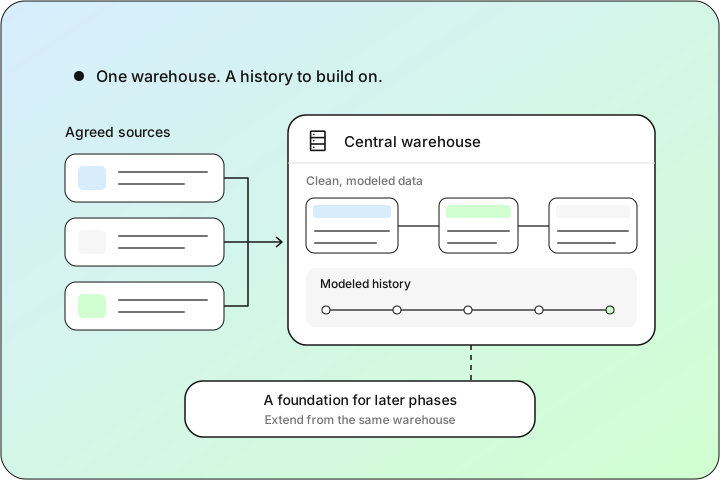
Central data warehouse
Store
Brought the agreed sources into one warehouse
A clean, modeled history to build on
A foundation to extend in later phases
-
02
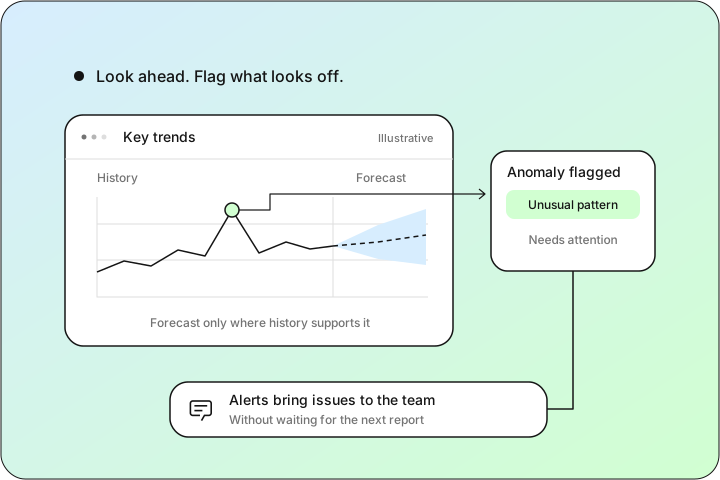
Forecasting & anomaly detection
Predict
Forecasts of key trends where the history supports them
Anomaly detection to flag what looks off
Alerts so problems surface early, not in a report
-
03
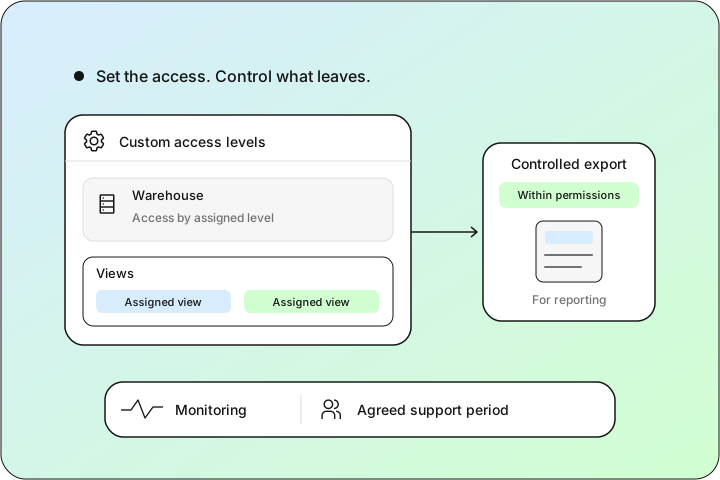
Access & exports
Govern
Custom access levels to the warehouse and views
Controlled exports for reporting
Monitoring and an agreed support period
Stack used
- Next.js
- TypeScript
- Node.js
- BigQuery
- Python
- PostgreSQL
- Prisma
- Redis
Implementation approach
Phased delivery.
-
01
Build the warehouse
Brought the agreed sources into a central warehouse and modeled a clean history to build on.
-
02
Add forecasting
Developed forecasting and anomaly detection where the history supported it, and set up alerts.
-
03
Govern and phase in
Set access levels and controlled exports, added monitoring, and rolled it out in phases.
Results
Outcomes at a glance.
- Central warehouse
- Forecasting
- Anomaly alerts
Our numbers lived in six places, and every question meant a week of archaeology. They modeled it all into one warehouse first — boring, deliberate, worth it. The forecasts exist only where the history actually supports one, which I respect: nobody's pretending the seasonal lines are science. The part that pays for itself is the anomaly flags — we hear about the spike or the silent drop the day it happens, not three weeks later in the monthly review. Access and exports are governed, and it came in phases, so each phase had to earn the next.
- Brought scattered data into one modeled warehouse
- Forecast key trends where the history supported it
- Flagged anomalies early instead of in a monthly report
- Governed access and exports, and delivered in phases
Impact & outcome
From hindsight to foresight.
We moved a business from reporting the past to anticipating it — a central warehouse feeding forecasts and anomaly alerts that surfaced problems early.
The honesty mattered: forecasts went only where the history supported them, so the numbers stayed credible instead of confidently wrong.
Built in phases on a clean warehouse, it left a clear path to add more models and sources as the business grew into them.
Reporting the past instead of the trend?
We build warehouses that forecast and flag anomalies early — governed, monitored, delivered in phases. We'll reply within one business day — no pressure, no sales script.
Start your project →