
Case study · Data
Live KPI Dashboards.
Dashboards pulling from your live systems, with drill-downs
We connected a business's live data sources into one always-current set of dashboards — automated refresh, drill-downs, and the right view for each role.
Start your project →- Industry
- Data & analytics
- What we built
- 3 integrated components
- Key outcome
- 5 → 1 Exports to one view
Overview
One current view, not five exports.
Leadership's numbers lived in several systems, and every review meant someone exporting from each and stitching a spreadsheet together by hand.
They wanted current dashboards they could trust, with the ability to drill into the detail behind a number.
- Numbers scattered across several systems
- Hours lost to manual exports before every review
- Reports stale by the time they were read
- No easy way to drill from a number to its detail
The goal was always-current dashboards connected to the live sources, with drill-down behind every metric.
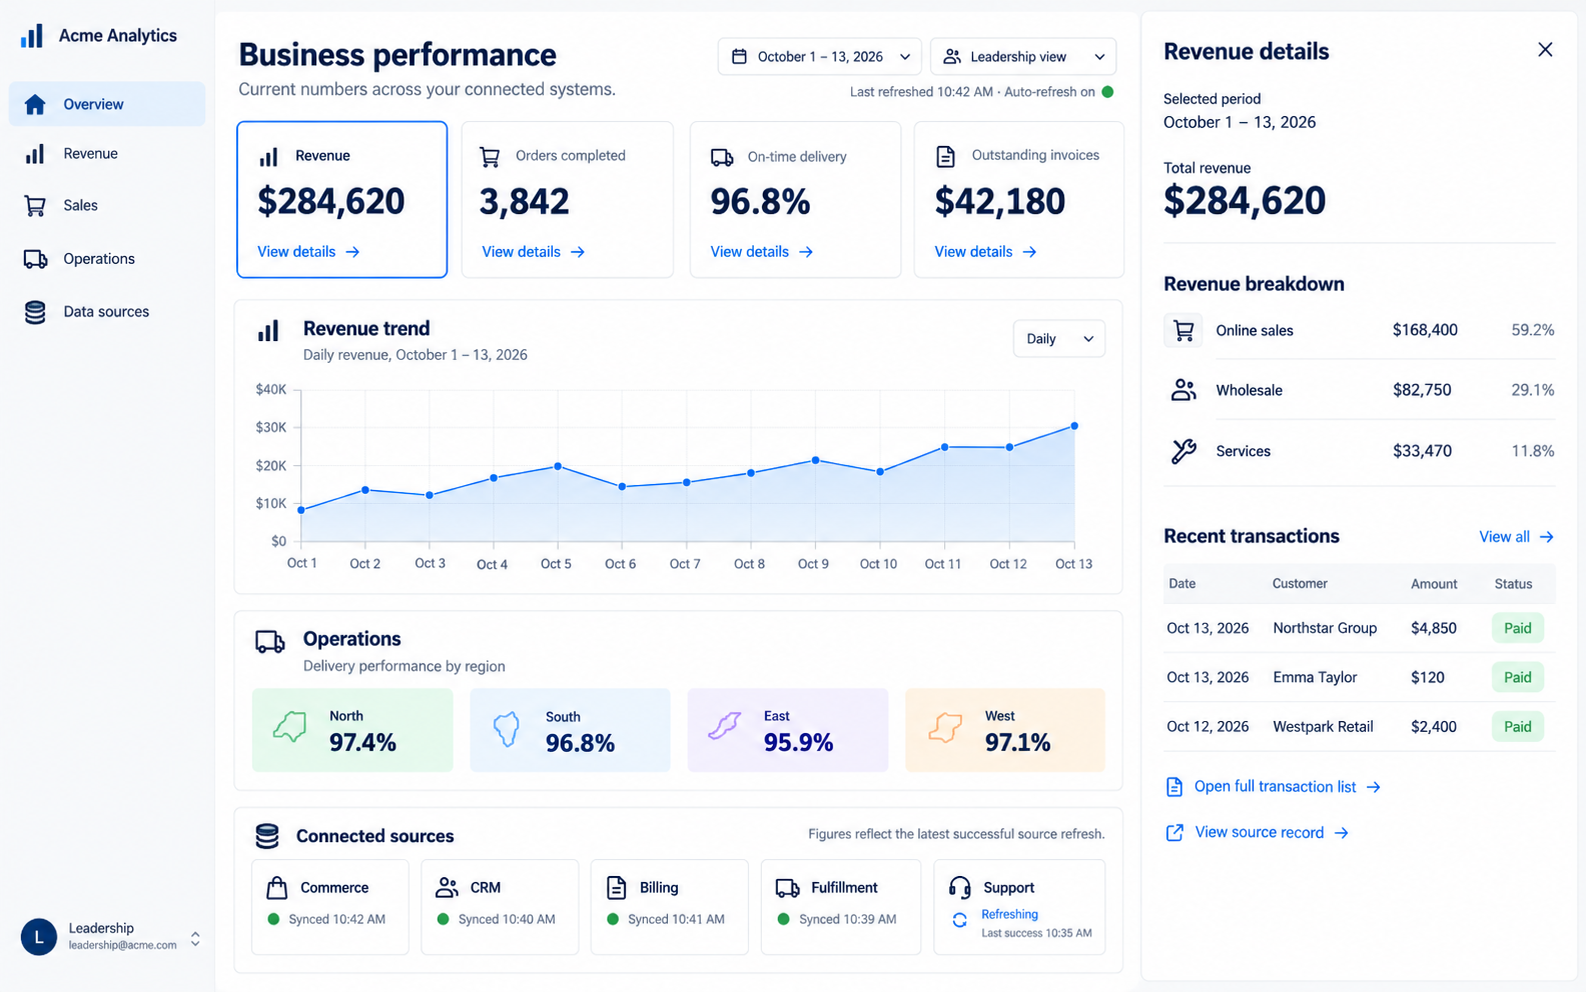
Experience flow
From live sources to drill-down dashboards.
The solution
Dashboards wired to your live data.
We connected the business's live sources through a light pipeline into dashboards that refresh automatically and let you drill into any number.
Core components
Connect the sources, keep them current, and make every metric explorable.
-
01
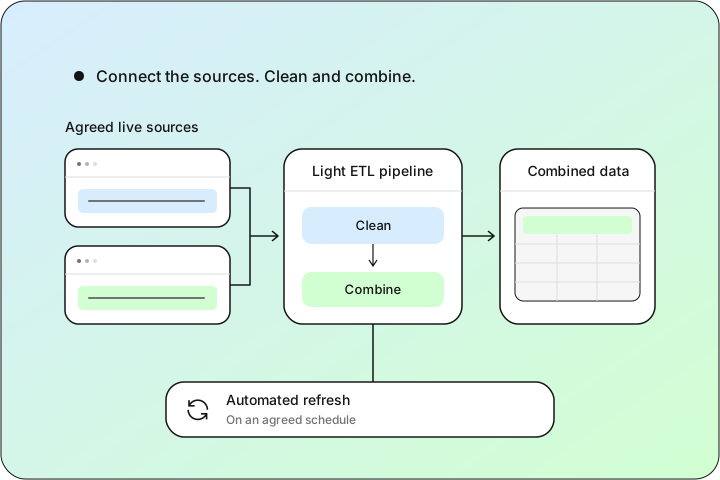
Source connections & ETL
Pipeline
Connected the agreed live data sources
A light ETL pipeline to clean and combine the data
Automated refresh on an agreed schedule
-
02
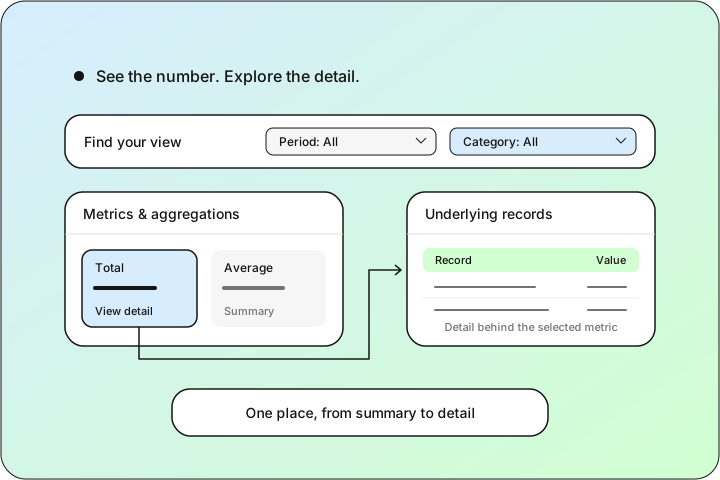
Metrics & drill-downs
Dashboards
The key metrics and aggregations in one place
Drill-downs from a number into its detail
Filtering so each person finds what they need
-
03
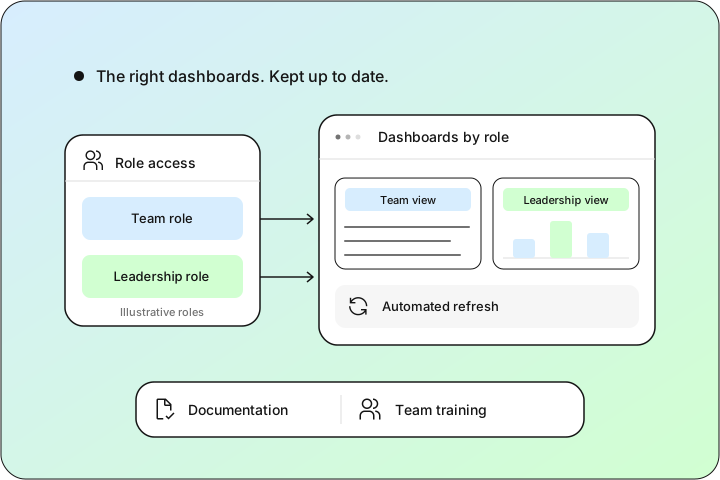
Roles & refresh
Access
Role-based access to the right dashboards
Automated refresh so numbers stay current
Documentation and training for the team
Stack used
- Next.js
- TypeScript
- Node.js
- Python
- PostgreSQL
- Prisma
- Redis
Implementation approach
Phased delivery.
-
01
Connect the sources
Agreed the live sources and refresh frequency, and built the light pipeline to clean and combine the data.
-
02
Design the dashboards
Built the metrics, aggregations, drill-downs, and filtering around how the team makes decisions.
-
03
Access and train
Set role-based access, scheduled the automated refresh, and trained the team.
Results
Outcomes at a glance.
- Live sources
- Auto-refresh
- Drill-downs
Monday used to start with me exporting from five systems into one deck — by the time leadership saw it, the numbers were already three days old. Now there's one view that's always current, fed straight from the sources through a light pipeline, not some data-platform project. Any figure can be clicked down to the visit or the claim behind it, which quietly ended the 'can you pull the detail' emails. And everyone gets the right view: front desk sees the schedule, providers see theirs, finance sees it all.
- Replaced manual exports with one always-current view
- Connected the live sources through a light pipeline
- Let leadership drill from a number into its detail
- Gave each role the right access and dashboards
Impact & outcome
Current numbers, in one place.
We ended the pre-review export scramble — live sources feeding one set of dashboards that stay current on their own.
The value wasn't just the charts; it was the drill-down. A number you can explore is a number people trust and act on.
Built on a light pipeline, it left room to grow into a warehouse and forecasting when the business is ready.
Tired of exporting from five tools?
We connect your live sources into always-current dashboards with drill-downs and role-based access. We'll reply within one business day — no pressure, no sales script.
Start your project →