
Case study · Fintech
Investment Portfolio Tracker.
Real-time portfolio analytics & risk
We designed a financial analytics platform that helped investors monitor portfolio performance, evaluate risk exposure, and use predictive modeling to support smarter investment decisions.
Start your project →- Industry
- Finance & fintech
- What we built
- 5 integrated components
- Key outcome
- 6 wks To daily reporting the desk trusts
Overview
Real-time visibility into performance and risk.
An investment-focused business needed a portfolio tracking platform that could consolidate holdings, monitor market movement, analyze performance, and provide risk-aware insights for decision-making.
Existing workflows relied on fragmented brokerage data, manual spreadsheets, delayed reporting, and limited visibility into risk concentration across accounts and asset classes.
The main challenges included:
- Disconnected investment data across accounts, assets, and reporting tools
- Limited real-time visibility into portfolio value and allocation changes
- Manual risk assessment and performance comparison workflows
- Difficulty modeling future scenarios and potential market impact
The goal was a secure, real-time portfolio tracker that combined analytics, predictive modeling, and risk assessment in one decision-support platform.

Experience flow
From scattered holdings to real-time intelligence.
The solution
A real-time investment intelligence platform.
We developed a portfolio analytics system that connected holdings data, market feeds, predictive models, allocation analysis, risk scoring, and investor dashboards.
Core components
The platform turned portfolio data into clear financial insight through live tracking, scenario modeling, risk indicators, and performance analytics.
-
01
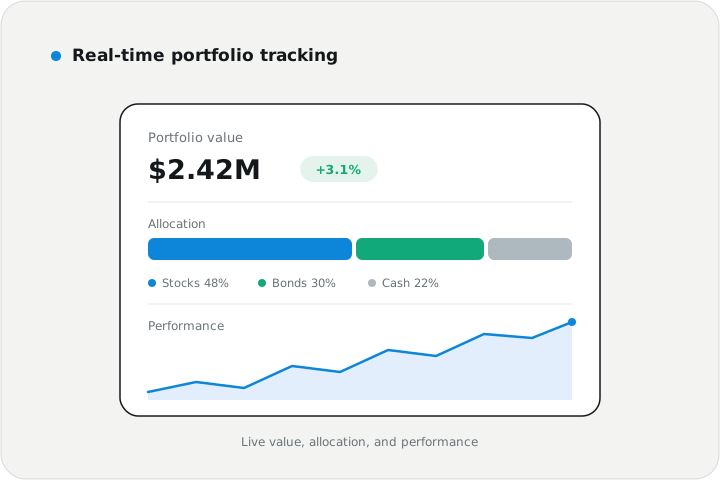
Real-time portfolio tracking
Tracking
Live portfolio value and asset allocation views
Holdings breakdown by account, sector, and asset class
Performance monitoring across custom time periods
-
02
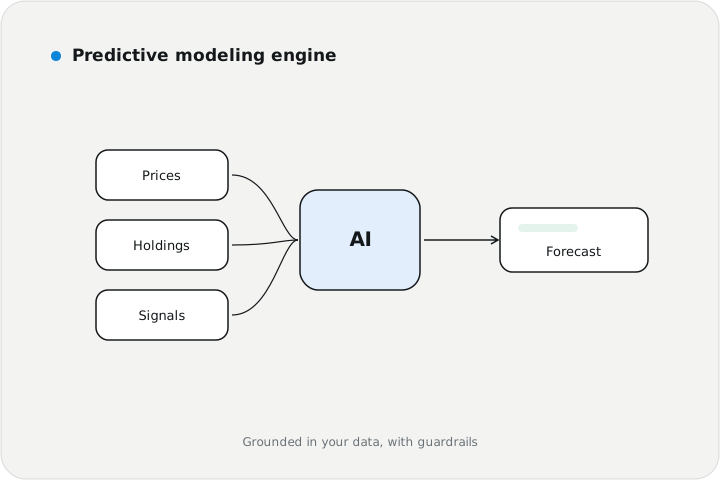
Predictive modeling engine
Modeling
Scenario modeling for projected portfolio behavior
Trend analysis based on historical and market data
Forecasting tools for planning and decision support
-
03
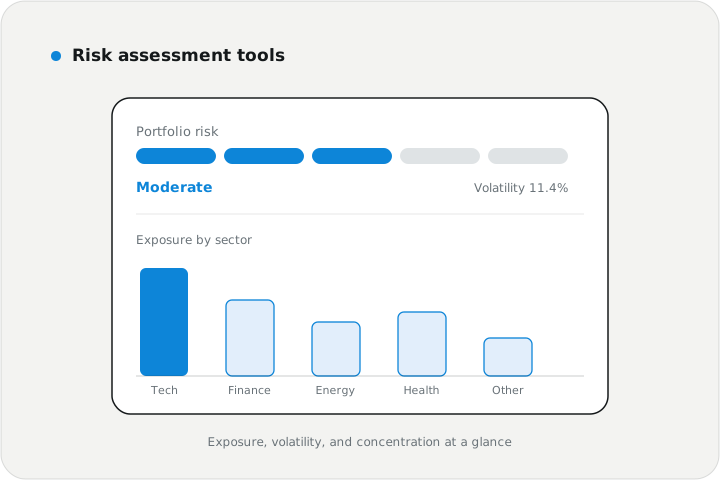
Risk assessment tools
Risk
Exposure analysis by sector, asset type, and concentration
Volatility and drawdown visibility
Portfolio risk indicators for faster review
-
04
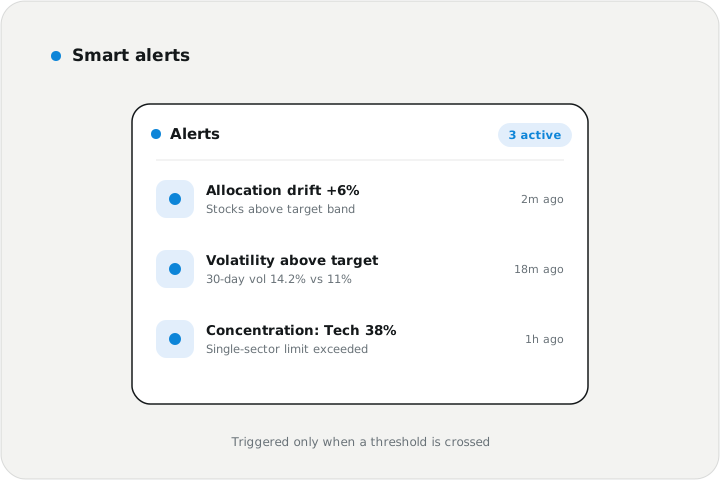
Smart alerts
Alerts
Threshold alerts for allocation drift and volatility
Performance notifications for major portfolio movement
Risk signals for concentrated or underperforming positions
-
05
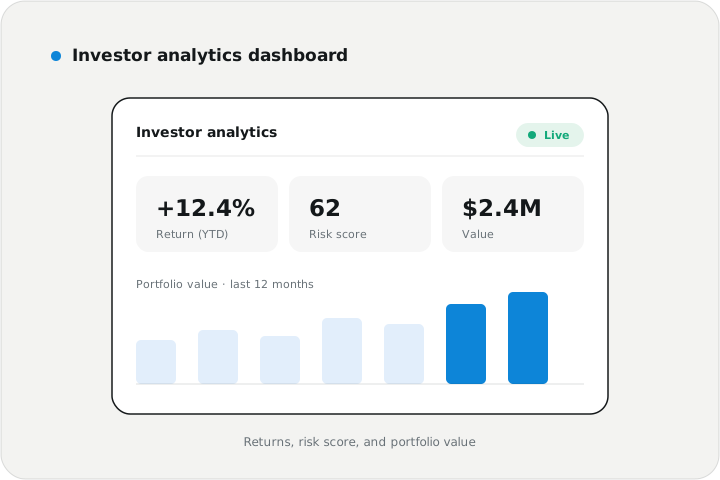
Investor analytics dashboard
Dashboard
Portfolio summary, risk score, and return analysis
Interactive charts for allocation and performance
Custom reporting for investors and advisors
Stack used
- Financial analytics platform
- Real-time market data
- Predictive modeling
- Risk assessment engine
- Portfolio dashboard
- Secure data pipelines
Implementation approach
Phased delivery.
-
01
Financial workflow assessment
Mapped portfolio sources, investor workflows, market data needs, risk metrics, and modeling requirements.
-
02
Analytics model design
Defined holdings structures, allocation models, performance metrics, risk indicators, and forecasting views.
-
03
Platform build
Implemented portfolio ingestion, market data processing, predictive modeling, risk scoring, alerts, and reporting.
-
04
Testing and launch
Validated data accuracy, chart behavior, risk calculations, forecast outputs, permissions, and dashboard usability.
Results
Outcomes at a glance.
- Real-time analytics
- Risk aware
- Forecast enabled
We had reporting we didn't trust and clients who knew it. They sorted the data plumbing first — unglamorous work, but it's why the numbers hold up now. Review meetings run twenty minutes shorter and nobody asks where a figure came from anymore.
- Improved visibility into portfolio value, allocation, and performance across connected accounts
- Enabled predictive scenario analysis to support planning and investment review
- Strengthened risk awareness through exposure, volatility, and concentration indicators
- Reduced manual reporting by centralizing dashboards, alerts, and portfolio analytics
- Created a scalable foundation for advisor tools, investor portals, and advanced financial modeling
Impact & outcome
A smarter foundation for decision support.
We delivered a portfolio tracking platform that helped investors move beyond static reports into real-time visibility, predictive insight, and structured risk analysis.
Investment platforms must make complex financial data easier to understand without hiding risk. This solution helped users evaluate performance, anticipate scenarios, and make more informed decisions through transparent analytics and risk-aware reporting.
Phase one skipped the risk engine on purpose — the desk wanted numbers it could trust before anything clever ran on top of them.
Need an investment analytics platform?
We build fintech software for portfolio tracking, predictive modeling, risk assessment, dashboards, and secure financial workflows. We'll reply within one business day — no pressure, no sales script.
Start your project →